by: Brian Davies, CFA® – Chief Investment Officer
Recovering from a 30% Drop
As of writing this post, we are 5.2 points away from hitting the all-time high on the S&P 500 (3393.52 on 2/19/20). This is an intraday high, not an all-time high at close. So far, the S&P 500 is up 54.2% off the bottom on 3/23/20. That’s an amazing return but begs the question: what is next for the S&P 500? According to Ned Davis Research, the S&P 500 took only 1.1 months to go from peak to trough in March. That is the fastest drop on record. The next fastest drop was the 1987 crash. On average these 30% drops took more than a year to go from peak to trough and the median was 17.8 months. If we make a high over the next few days it will be the fastest recovery of a 30% drop ever. Today we are at 4.7 months. In comparison, it took seven years for the S&P 500 to get back to its 2000 tech bubble high. The median time to go from trough to new high is 48.6 months. From a relative standpoint, the average downdraft was 16 times longer than the most recent 30% drop, and the average recovery was 10 times longer.
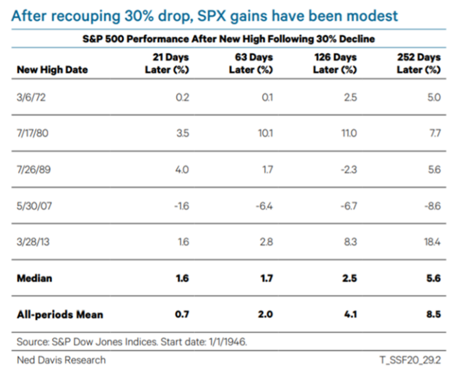
What is to come? Every one of these periods is different and the current period is no exception. Ned Davis put together the table below that looks at what the S&P 500 has done after recouping a 30% drop post-WWII. Since we are long-term investors let’s focus on the far-right column which looks at returns one year after hitting a new high. The median return is 5.6% and the mean is 8.5%. The best was 18.4% following the 2013 high. The worst was -8.6% post the ’07 high, and as we all know, that ’07 high was short-lived.

Source: Ned Davis Research
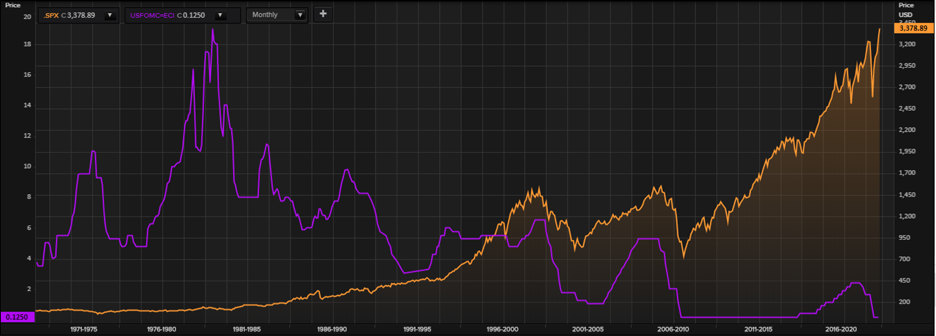
One thing we always think about when we see data like this is: what was the Fed doing at each period? In four of the five periods (1972/1980/1989/2007), the fed was tightening monetary policy. In 2013, the Fed was still embarking on QE and did not raise rates until 2015. For visual context, we have plotted the S&P 500 price (orange line) against the Fed’s policy rate (purple line) since the 1970s. You can see the aggressive rate increases that occurred during the aforementioned periods and the accommodative rate policy that the Fed has taken since 2008.

Source: Thomson Reuters
We are not making a prediction that the market will going up 18% over the next 12-months but we are pointing out that the Fed’s positioning might have something to do with the forward returns. It is also important to note that four of five periods took place right before a recession started. In summary, we have come a long way in a short amount of time. While the next 12-months will not be as strong as the past 4.7months, if the Fed is going to hold policy loose for longer, the returns for the S&P 500 might be slightly better than the median of the past five times the index recouped a 30% drop.
Disclosures:
Data Sources: Ned Davis Research, Thomson Reuters
S&P 500: The Standard & Poor’s 500 Index is a capitalization weighted index of 500 stocks designed to measure performance of the broad domestic economy through changes in the aggregate market value of 500 stocks representing all major industries.
The opinions voiced in this material are for general information only and are not intended to provide specific advice or recommendations for any individual. Economic forecasts set forth may not develop as predicted and there can be no guarantee that strategies promoted will be successful. All performance referenced is historical and is no guarantee of future results. All indices are unmanaged and may not be invested into directly.
Stock investing involves risk including loss of principal.
Bonds are subject to market and interest rate risk if sold prior to maturity. Bond values will decline as interest rates rise and bonds are subject to availability and change in price.
Investment advice offered through Shepherd Financial Partners, LLC, a registered investment advisor. Registration as an investment advisor does not imply any level of skill or training.
Securities offered through LPL Financial, member FINRA/SIPC. Shepherd Financial Partners and LPL Financial are separate entities.
Additional information, including management fees and expenses, is provided on Shepherd Financial Partners, LLC’s Form ADV Part 2, which is available by request.
Tracking #: 1-05044419
