by: Brian Davies, CFA – Chief Investment Officer
The 2Q Market Review examines the dramatic shifts that have occurred in the markets between the first and second quarters of this year. This paper provides a deep dive into what caused the change in risk appetite on the part of the investor and discusses the positioning of our portfolios during this volatile time. Enjoy!
Q2 Market Review
As we entered the second quarter in April, the capital markets were in the midst of one of the biggest crises in history. In fact, Q1’20 was the ninth worst quarter for the S&P 500 in the last 96-years (see Table 1). The news surrounding the Covid-19 Pandemic was coming at us at a fever pitch. Most of the news, if not all, was very negative and unsettling. During the last week of Q1, the markets found a bottom.
Here is where the turn-around began. Markets rallied aggressively through Q2 as the virus data ebbed and flowed. Aggressive monetary and fiscal policy actions encouraged the turn-around. Risk appetites changed on a dime. In fact, the S&P 500 went from one of the worst quarters to having one of the best, as shown in Table 1. In this paper, will we delve deeper into what caused the dramatic change in risk appetite. We will look at what worked and did not across asset classes. Finally, we will end with a look towards the rest of the year and what investors might expect as we move through this crisis.
Table 1: S&P 500 Best & Worst Quarter (per Returns 2.0)

Why the sudden change in Q2?
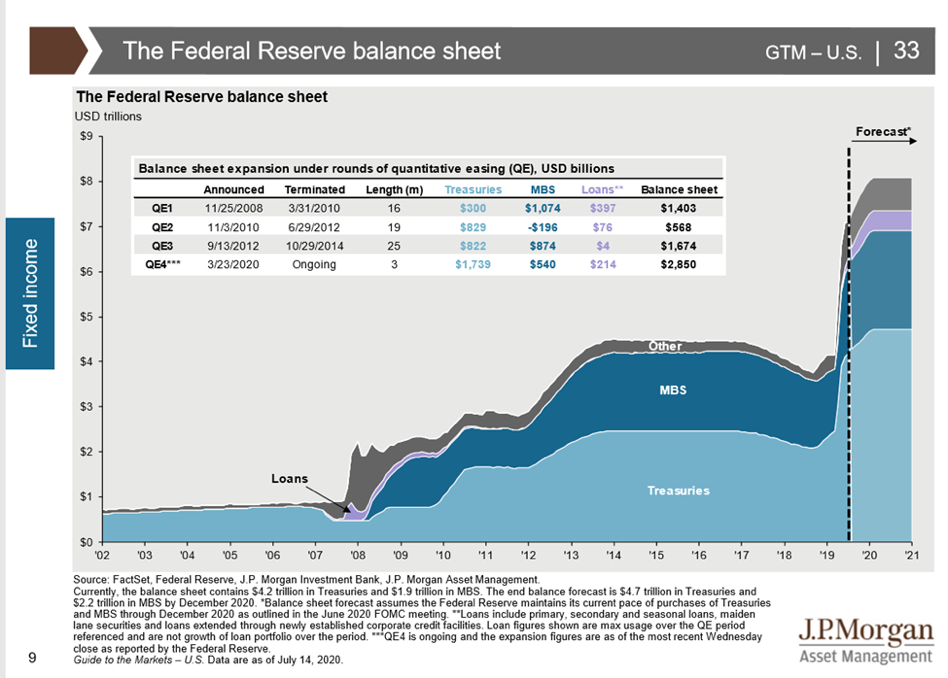
In our estimation, the markets’ dramatic shift from “deep crisis mode” to “risk on mode” has almost everything to do with the scale and speed of the fiscal and monetary response of global central banks and governments. Normally, when a recession starts, it takes the monetary and fiscal authorities many months, if not years, to respond with stimulus and relief. In this crisis, the response happened within weeks of the start of the recession. The NBER estimates that the recession started sometime in February. By mid-March, the Federal Reserve was starting on their historic efforts to backstop the economy. The scale and speed have been unprecedented. As you can see from Chart 1, the Federal Reserve has grown its balance sheet in this iteration of Quantitative Easing (QE) by $3.0 trillion in under a month. In contrast, after the Great Financial Crisis, it took the Fed 5-years and multiple QE’s to get the balance sheet growth to $3.0 trillion.
Chart 1: The Federal Reserve Balance Sheet 2002-Present (per JP Morgan Asset Management)
What was the global response?
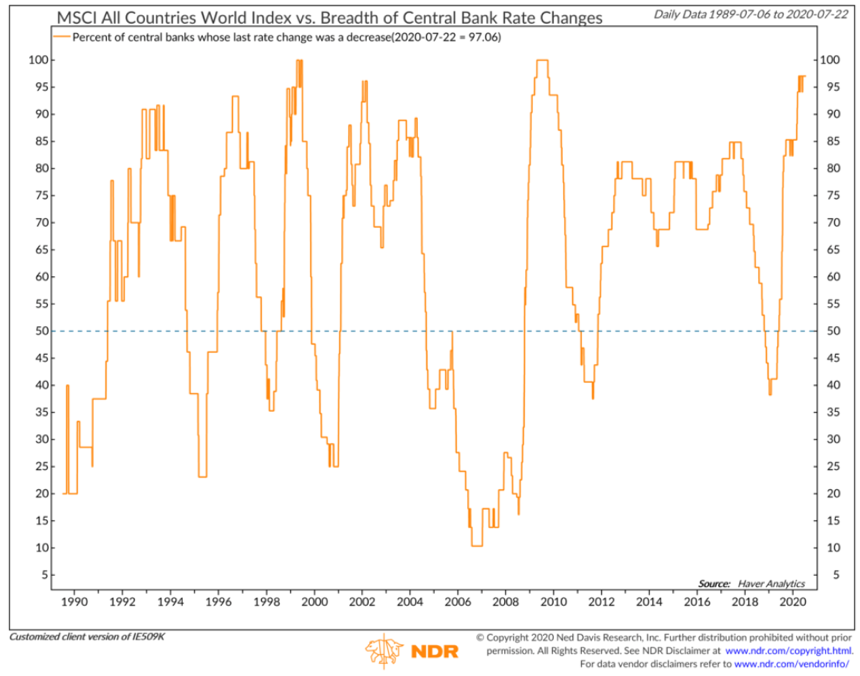
This type of action has not been solely a U.S. event. As of mid-July, 97% of the central banks in the world have their last monetary move as a rate cut (Chart 2). The last time this many central banks acted in such a coordinated fashion was spring of 2009 during the Great Financial Crisis. Historically, the forward returns on risk assets have been very positive when central banks are this aggressive with loosening monetary policy.
Chart 2: % of Central Banks whose last rate change was a cut (per Ned Davis Research)
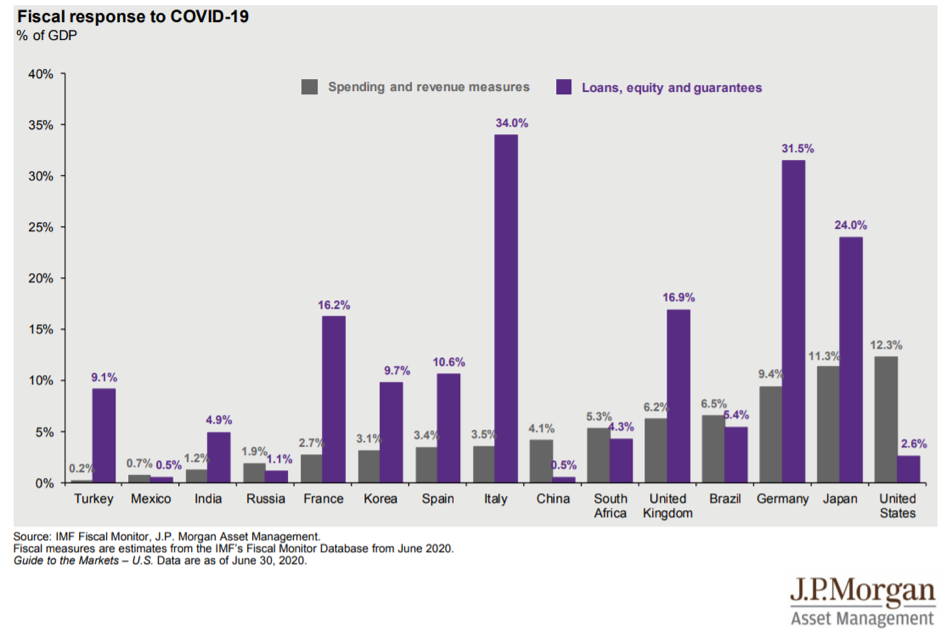
The monetary authorities haven’t been the only ones working to provide relief. The global fiscal response has been just as aggressive. We have seen massive injections and support in the U.S., Japan, and areas of Europe. Germany, typically known for conservative spending habits, has responded quickly with stimulus spending of 31.8% of its GDP and loans and guarantees of over 9.0% GDP (Chart 3). As of this writing, the U.S. is close to passing another fiscal relief package that is expected to be around one trillion dollars. Some of the initial programs the Federal Government put in place in March expire at the end of July. With the virus still looming and impacting lives, an extension or adjustment of support seems likely.
Chart 3: Fiscal Response to Covid-19 (per J.P. Morgan Asset Management)
What worked in Q2:
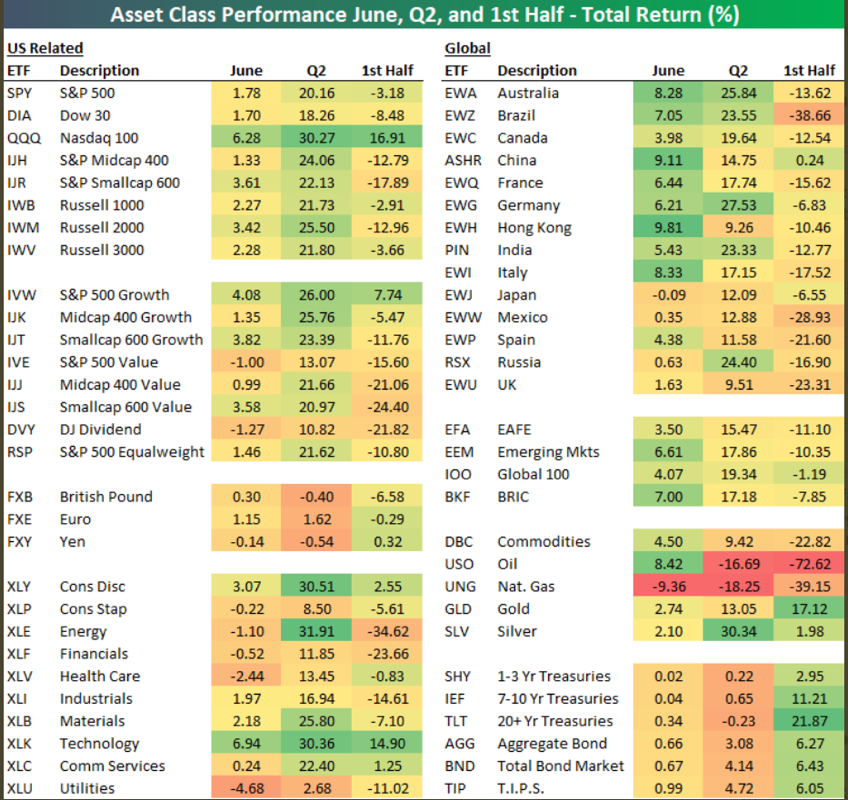
As we saw in Table 1, the S&P 500 was up 20.5% during the second quarter. The asset classes that suffered the most in March saw the biggest rally in Q2. Emerging Market stock and bonds were both up double digits during the quarter. Small Cap stocks in the U.S. were up over 25.0%. Investment grade bonds and high yield bonds saw solid return in the quarter as the Fed Reserve targeted those specific asset classes for support. The asset classes that did not participate in the rally were the ones that did the best during the upheaval of March. Treasury bonds across the curve were essentially flat in the quarter. That’s actually decent performance for a quarter with such a risk-on tone. When we see risk hedges like treasury bonds remain flat while risk assets rise sharply, this indicates a strong near-term demand for solid and safe assets like government bonds. In our estimation they will be a good hedging instrument until the Fed steps back from its current monetary policy stance, which could be anywhere from twelve to twenty-four months away depending on the trajectory of the virus and the economy.
Performance by sector of the S&P 500 in Q2 was broad based and included both growth and value sectors (see Table 2). Energy saw the biggest rally as the price of Oil proved very volatile during the month. West Texas Intermediate Crude oil (WTI) went below zero in mid-April before staging a dramatic rally to close the quarter at almost $40.00 per share. Consumer Discretionary and Technology followed energy with both sectors up over 30% in the quarter. The growth companies in both of those sectors have seen that type of performance carried into the early parts of Q3 as investors are attracted to business models that are almost Covid-19 proof.
The laggards from a sector standpoint were the traditional defensive sectors like Consumer Staples and Utilities. They were positive during Q2 but did not see the double digit returns of the other sectors. You would expect those sectors to lag when the market takes such a risk-on tone as it did in the quarter.
Table 2: Q2 2020 Performance (Per Bespoke Investment Group):
What to expect moving forward:
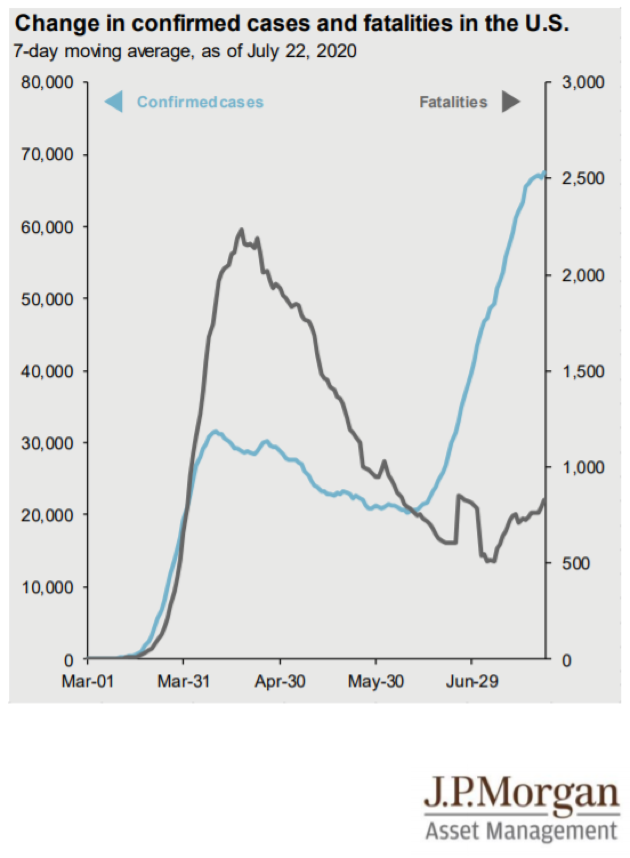
So here we sit, having just experienced one of the best quarters in history for risk assets, which, as we know, followed one the worst quarters in history for risk assets. Unfortunately, as we type this, the virus is still a major global issue. The U.S. recently passed the case number peak of early April (Chart 4) but, thankfully, fatalities have yet to reach the awful numbers we saw April and early May. The global economy has bounced back somewhat from the depths of late Q1 and early Q2. We have seen improvements in retail sales, leading indicators, housing sales, and manufacturing activity. This improvement coincides with economies opening back up. Where the case numbers have shrunk (China/Europe), the economies seem to be faring well. Where the cases number are more volatile (U.S./Latin America), the recovery might be slow to take hold. Very recently, in the U.S we have seen the employment data move sideways likely caused by certain states slowing their re-openings as they deal with rising case numbers.
Chart 4: Covid-19 case nu (per J.P. Morgan Asset Management):
We won’t attempt to take a guess at the shape of the recovery; however, we do believe we will see one. Strong employment conditions are a must for a sustained economic recovery in the U.S. If this doesn’t occur, then risk assets might be challenged in the short-term. Because of the uncertainty surrounding the virus, we continue to advocate neutral asset allocation for balanced portfolios. This has served us well through this crisis. If we were too aggressive in late February at the beginning of the crisis, we would have paid a big price in March. Also, if we took an extreme bearish stance in March, we would have missed the rally in risk assets. With monetary and fiscal policy at their current extremes, we think the risk of a repeat of March is minimal. We do expect a recovery in 2021 but the shape will again be difficult to predict. Given the uncertainties in the economy and with the virus, we feel it is prudent to maintain a neutral asset allocation stance.
Summary:
After back to back historical quarters for stocks, we still are dealing with the ebb and flow of Covid-19. Because of uncertainty that surrounds the future, until a vaccine is in place, we maintain a neutral asset allocation stance across investment portfolios. We still like stocks over bonds long-term. We would look to add risk to portfolios if volatility spiked and forward risk return profile of risk assets appeared very much in the long-term investors favor. We are mindful this volatility can appear at any time and hedging that potential volatility seems prudent in this environment. Fixed Income yields are at extreme lows and such future portfolio returns will be hard pressed to match those of the past. Adherence to risk management practices in an investment management process is of ultra-importance as investors strive to generate returns on their capital. We feel strongly that the SFP investment process is structured exactly for times like these.
We realize times continue to be challenging for everyone. Once again, the entire team at Shepherd Financial Partners wants to thank you for allowing us to be part of your financial journey. We are honored you have chosen us to partner with. If you have any questions or concerns, please email or call the office. We are here for you and always look forward to interacting with you. Please continue to be safe and stay healthy.
Disclosures:
Bloomberg Barclays U.S. aggregate bond: The Bloomberg Barclays U.S. Aggregate Bond Index is an index of the U.S. investment-grade fixed-rate bond market, including both government and corporate bonds.
S&P 500: The Standard & Poor’s 500 Index is a capitalization weighted index of 500 stocks designed to measure performance of the broad domestic economy through changes in the aggregate market value of 500 stocks representing all major industries.
The Bloomberg Commodity Index (BCOM) is a broadly diversified commodity price index.
The opinions voiced in this material are for general information only and are not intended to provide specific advice or recommendations for any individual. Economic forecasts set forth may not develop as predicted and there can be no guarantee that strategies promoted will be successful. All performance referenced is historical and is no guarantee of future results. All indices are unmanaged and may not be invested into directly.
Stock investing involves risk including loss of principal.
Bonds are subject to market and interest rate risk if sold prior to maturity. Bond values will decline as interest rates rise and bonds are subject to availability and change in price.
Duration is a measure of the sensitivity of the price (the value of principal) of a fixed income investment to a change in interest rates. It is expressed as a number of years. Rising interest rates mean falling bond prices, while declining interest rates mean rising bond prices. The bigger the duration number, the greater the interest-rate risk or reward for bond prices.
High yield/junk bonds (grade BB or below) are not investment grade securities, and are subject to higher interest rate, credit, and liquidity risks than those graded BBB and above. They generally should be part of a diversified portfolio for sophisticated investors.
Floating-rate loans are often lower-quality debt securities and may involve greater risk of price changes and greater risk of default on interest and principal payments. The market for floating-rate loans is largely unregulated and these assets usually do not trade on an organized exchange. As a result, floating-rate loans can be relatively illiquid and hard to value.
International investing involves special risks such as currency fluctuation and political instability and may not be suitable for all investors. These risks are often heightened for investments in emerging markets.
Investment advice offered through Shepherd Financial Partners, LLC, a registered investment advisor. Registration as an investment advisor does not imply any level of skill or training.
Securities offered through LPL Financial, member FINRA/SIPC. Shepherd Financial Partners and LPL Financial are separate entities.
Additional information, including management fees and expenses, is provided on Shepherd Financial Partners, LLC’s Form ADV Part 2, which is available by request.
Tracking #: 1-05038866
