Written by: Chris Cogliano, Portfolio Specialist/Investment Analyst
Key Takeaways:
- Markets continued their downward trend in September.
- The bond market continues to be volatile; however, opportunities in bonds may exist for your portfolio.
Market Recap:
September markets followed the same downward trend as August with continued weakness in all areas. The global equity markets fell with U.S. Large Cap and U.S. Small Cap stocks down 4.77% and 5.89%, respectively. International equities did not fare well either, with developed markets down 3.37% and the emerging part of the market down 2.58%. This was the second month in a row for weak equity performance given the strong start to the summer. Fixed income also fell significantly with the Bloomberg U.S. Aggregate and Investment Grade Corporates down approximately 2.5% each, in part due to the upward move in rates. Real Estate was down 7.27% last month, yet until then, it was flat for the year. Commodities were the biggest winners for the month and are now slightly positive for the year thanks to oil, cattle, and sugar.
The story remains the same as in August; equities are under pressure from a solid start to the summer in growth, and fixed income has been facing headwinds in a rising rate environment.
Chart of the Month:

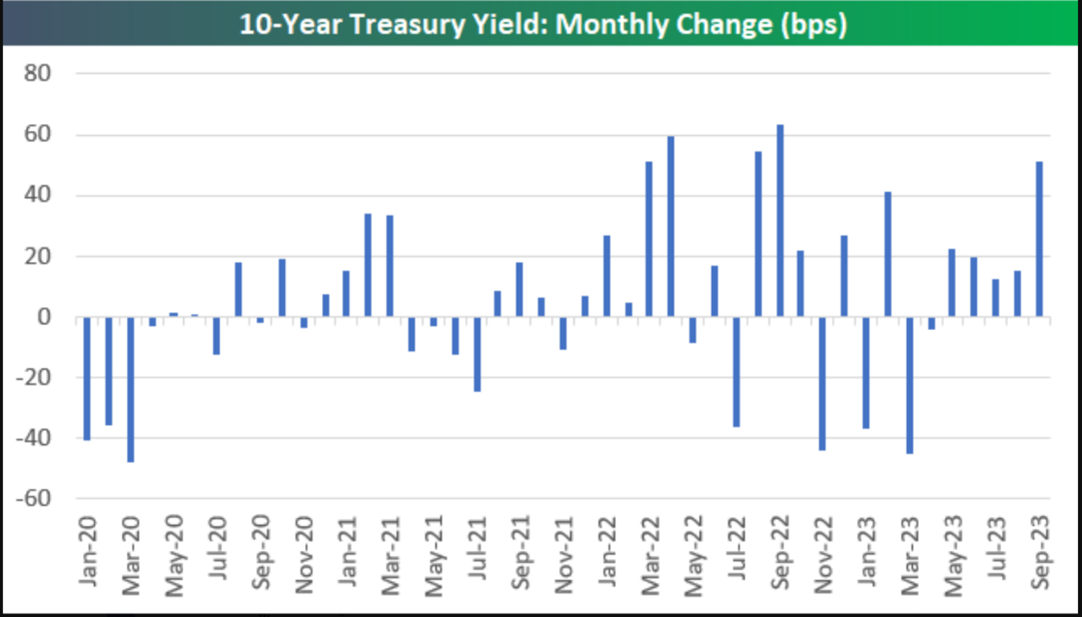
Following on the theme of last month’s chart explaining the 3-year bear market in fixed income, this chart displays monthly changes in the 10-Year Treasury Yield going back over the same 3-year period. Remember, the yield on fixed income instruments determines the return an investor can expect1. We have been in a 3-year bear market, and it has been a fairly volatile one at that! Why do we believe this is noteworthy? As the chart shows, there have been significant short-termed swings both up and down in bond yield, making it difficult to make tactical moves in fixed income; however, we believe that strategic, long-term opportunities exist.
This has been a unique time in history for fixed income as the market grapples with all-time low rates in 2020 to multi-decade high rates in 2023. What does this mean for investors? With higher rates, there are strategic, long-term opportunities for bonds in diversified portfolios. Call us today to review your current allocation and your long-term investment goals.
1 Bond yield is the return an investor realizes on an investment in a bond. A bond can be purchased for more than its face value, at a premium, or less than face value, at a discount. The current yield is the bond’s coupon rate divided by its market price. Price and yield are inversely related, and as the price of a bond goes up, its yield goes down.
Disclosures
Content in this material is for general information only and not intended to provide specific advice or recommendations for any individual. All performance referenced is historical and is no guarantee of future results. The economic forecasts set forth in this material may not develop as predicted and there can be no guarantee that strategies promoted will be successful.
All indices are unmanaged and may not be invested into directly.
The opinions voiced in this material are for general information only and are not intended to provide specific advice or recommendations for any individual.
Investment advice offered through Shepherd Financial Partners, LLC. A registered investment advisor. Registration as an investment advisor does not imply any level of skill or training.
Securities offered through LPL Financial, member FINRA/SIPC. Shepherd Financial Partners and LPL Financial are separate entities. Additional information, including management fees and expenses, is provided on Shepherd Financial Partners, LLC’s Form ADV Part 2, which is available by request.
The content is developed from sources believed to be providing accurate information.
Sources: Y-Charts and FDIC
Tracking # 488727-3
