Written by: Chris Cogliano, Portfolio Specialist/Investment Analyst
Key Takeaways:
- Markets continued their downward trend in October.
- Real estate returns are expected to lower and approach the long-term average of 4 percent over time.
Market Recap:
We are seeing similar market results in October as we did in September and August. The global equity markets fell again with U.S. Small Caps down 6.82% and International Stocks, both developed and emerging down 4.04% and 3.87%, respectively. U.S. Large Cap followed the same trend, although faring better than the formerly mentioned indices being down 2.1%. Fixed income also fell in October, although relatively outperforming equities. The Bloomberg U.S. Aggregate and Investment Grade Corporates were down 1.58% and 1.63%, respectively, as rates continued to rise in October despite no action from the Fed since July.
The story remains the same: equites have been under pressure since the strong growth run at the start of the summer and fixed income, up until this point, has been facing rate headwinds.
Chart of the Month:

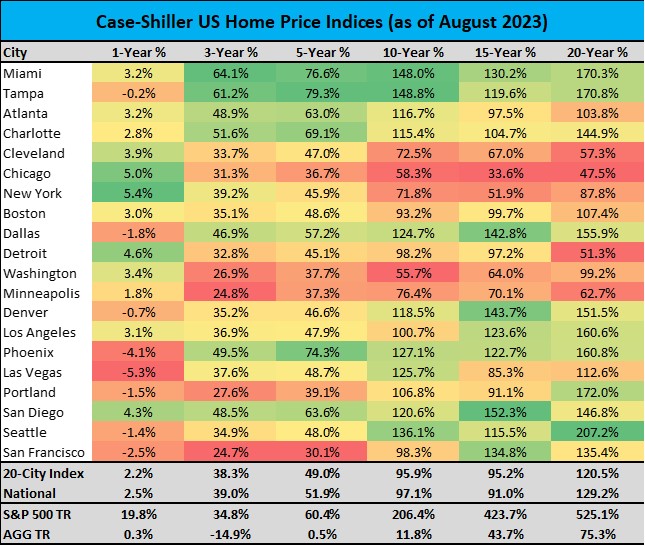
The chart of the month displays the Cash-Shiller Home Price Indices annualized returns over short- and long-term time periods. Its takeaway: investors should consider the long-term return profile of real estate and not expect the returns we’ve seen in recent years. Let’s break this down. As shown, the 3- and 5-year return figures are on average more than double the 15- and 20-year return figures. How did this happen and what does this mean going forward? We can look to recent interest rate history and see that the periods of high annualized return happened when rates were historically low. In general, when mortgage rates are low, the monthly debt burden for a property is much lower all else equal, and therefore individuals may be willing to pay more for a property thus driving up prices. On the flipside, when mortgage rates are high, the monthly debt burden will increase and cause individuals to be more averse to paying more for the same property.
In 2020, we experienced historically low rates, and therefore we saw a boom in real estate prices with an 3-year annualized return for the 20-City Index of 11.4 percent. If we look to history to understand what longer-term averages are, we come up with 4% annualized return over the 20-year period. So what does this mean going forward? We believe returns will move back to a 4% average return over the long-term. We do not believe this will be achieved by major swings down, but more so in less-than-average growth over a longer period of time. With rates at multidecade highs, this scenarios seems overwhelmingly the case.
What does this mean for investors? If you are planning to purchase real estate, reach out to your Shepherd team. We can help you review the opportunity and see how it may impact your financial plan. Give us a call today!
Disclosures
Content in this material is for general information only and not intended to provide specific advice or recommendations for any individual. All performance referenced is historical and is no guarantee of future results. The economic forecasts set forth in this material may not develop as predicted and there can be no guarantee that strategies promoted will be successful.
All indices are unmanaged and may not be invested into directly.
The opinions voiced in this material are for general information only and are not intended to provide specific advice or recommendations for any individual.
Investment advice offered through Shepherd Financial Partners, LLC. A registered investment advisor. Registration as an investment advisor does not imply any level of skill or training.
Securities offered through LPL Financial, member FINRA/SIPC. Shepherd Financial Partners and LPL Financial are separate entities. Additional information, including management fees and expenses, is provided on Shepherd Financial Partners, LLC’s Form ADV Part 2, which is available by request.
The content is developed from sources believed to be providing accurate information.
Source: Y-Charts
Tracking # 504300-2
