The housing market has been hot! Here is specific information that you may find interesting.
The National Association of Home Builders website is one source for housing data. This website contains articles that focus on specific factors of the general American demographic such as regions of the country and generational differences in the housing market.
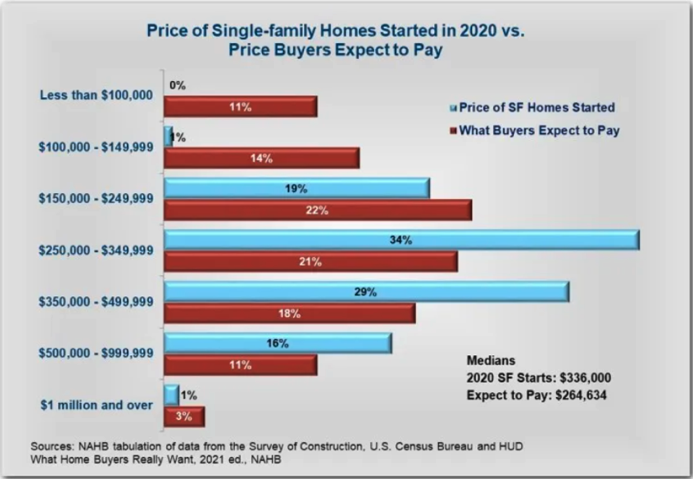
The NAHB website also provides insights on housing affordability. The chart below shows housing prices as compared to what people expect to pay for houses. Essentially, there is no product for the bottom one fourth of the home buying market looking for new house. Also, the median sales price for existing homes in May was $350,300, up 23.6% from a year earlier.

Regional Centers:
Next, let’s take a look at two hot markets: the San Francisco Bay area and the greater metropolitan New York City area.
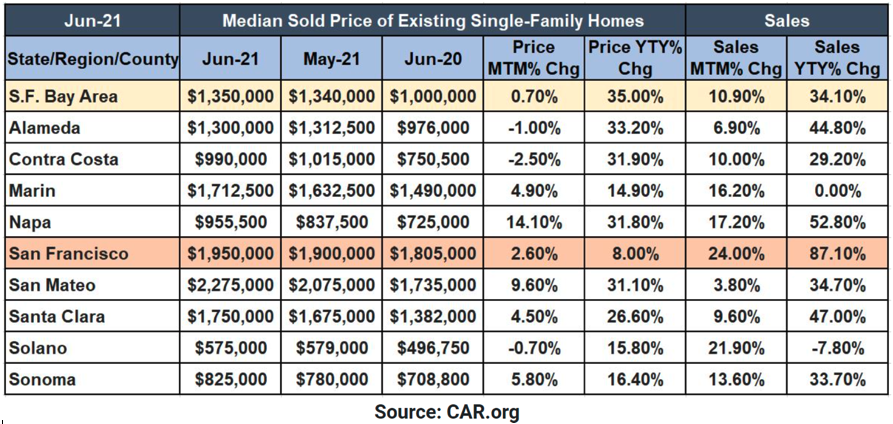
According to the San Francisco Bay Area home pricing guide, the median sales price for homes in this area has topped $1 million for the fourth month in a row and is estimated to continue to rise until 2022. As of this June, the median price was $1,350,000 which is a 35% increase from a year ago and the highest year-over-year gain in California. There is very high demand for houses in this area, which has led to a scarcity of inventory. Low-interest mortgage rates have been hard to resist for buyers, and as of this June, the month’s supply of existing single-family homes has fallen to 1.4 months from 2.3 months last June. Houses are also selling for more than their asking price as buyers are willing to spend more in order to win bids given low inventory. Sales Price to List Price ratio in the Bay Area was 109.9% this June. Another segment driving prices higher is suburban area homeowners who are looking for more space and larger homes.

Next, we look at the prices and demand in Manhattan, NYC. The median resale price of a Manhattan apartment has hit $999,000, which is the highest on record and is a 12% increase on average sale prices in the last quarter. Prices are rising and inventory is decreasing as the Manhattan real estate market rebounds following the pandemic. Demand for the largest, most expensive apartments has risen as families look to trade up for more space. This combined with increasing wealth among the wealthiest Americans has propelled growth at the high-end of the market. In fact, housing in this tier (above $5 million) has seen a huge turnaround from pre-pandemic conditions when the $1-2 million market was the strongest. The overall buying spree is resulting in a limited inventory of apartments, which has dropped by 27% from a year ago.
Looking at the housing trends of the suburbs of New York City, we see a slowdown from the buying frenzy that endured during the pandemic and persisted through this May. Many people rushed into the suburbs during the pandemic, but this is easing as people are starting to move back into the city. Year-over-year growth of single-family home contracts has slowed in June in desired areas such as Greenwich, Westchester, and Long Island. This is also due to wary would-be buyers who are leaving the market due to bidding wars and low inventory.
Overall, the housing market is extremely competitive with high prices, high demand, and low inventory. At the upper end of the market, wealthy buyers continue to desire bigger and more expensive homes. This tends to drive prices upward across the board making home buying difficult for all buyers including those in the lower-income portion of the market.
Website Links:
https://www.nar.realtor/research-and-statistics
https://www.noradarealestate.com/blog/san-francisco-real-estate-market/
Disclosures:
Content in this material is for general information only and not intended to provide specific advice or recommendations for any individual. The economic forecasts set forth in this material may not develop as predicted and there can be no guarantee that strategies promoted will be successful. All indices are unmanaged and may not be invested into directly. Unmanaged index returns do not reflect fees, expenses, or sales charges. Index performances not indicative of the performance of any investment.
Past performance is no guarantee of future results.
Investment advice offered through Shepherd Financial Partners, LLC, a registered investment advisor. Registration as an investment advisor does not imply any level of skill or training.
Securities offered through LPL Financial, member FINRA/SIPC. Shepherd Financial Partners and LPL Financial are separate entities.
Additional information, including management fees and expenses, is provided on Shepherd Financial Partners, LLC’s Form ADV Part 2, which is available by request.
Tracking #: 1-05186731
