by: Brian Davies, CFA – Chief Investment Officer
Overview
The yield curve inverted and all the talk has been about a potential recession. We use the yield curve as one of seven factors to assess the economy.
- Everybody seems to want to compare this cycle with cycles of the past.
- Trying to call an actual recession is always difficult. We feel certain conditions exist today that are much different from past cycles.
- We will use this paper to point out a few areas where this cycle’s conditions are not behaving like past cycles and how that could play out in light of an economic slowdown or contraction.
The U.S. Treasury yield curve inverted recently, and as a result, the media is full of hysteria discussing why a recession will be soon be at hand. Yes, historically a yield curve inversion has preceded a recession in economic activity in the U.S. We are fully aware of this and value the yield curve as an economic indicator. We have been on high alert as the curve has flattened throughout the past few years, and have written several papers highlighting this trend. However, we find it valuable to study how the yield curve impacts the economy. This paper will examine the current cycle versus past cycles with a focus on credit creation (i.e. loan/leverage growth) and financial intermediaries funding costs. In light of recent yield curve moves, it is important to examine potential economic impacts if the recession signal is real.
Credit Creation
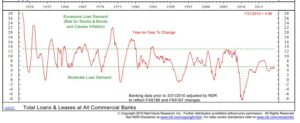
As we have written before, credit is the lifeblood of the economy. Yield curve moves influence the incentive for lenders to create credit. Past economic cycles have seen credit growth on the part of households and corporations grow around 15% per year for a number of years as cycles extended. As Chart 1 from Ned Davis shows, typical cycles peak with the year over year change in loan growth at banks somewhere near 13%. You can see in the mid 2000’s, late 1990’s and mid 1980’s, loan growth ran North of 10% per year. This cycle, however, we have struggled to see loan growth hit high single digits. The last two years have seen loan growth at barely 5%. Now, when the cycle turns it usually results in loan growth going from mid-teens growth to zero and in extreme cases (2009/2010) going deeply negative. The lack of accelerated credit growth this cycle is one reason we do not see imbalances in credit like past cycles. In past cycles, when the yield curve inverted, the economy was running at a much hotter pace and thus hit a wall and growth went to zero. This cycle, because we are running so close to zero, it feels like a fall in credit creation will be like falling out the basement window. While we do not want to downplay what a slowdown of any magnitude means, we do not see the severity of past cycles thanks to the lack of severe credit imbalances.
Chart 1: Per Ned Davis Research, Loan growth at Commercial Banks
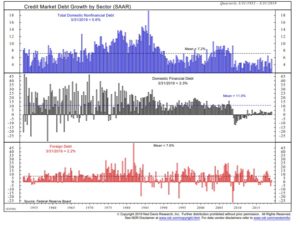
Another way to view this is by looking across different sectors in the economy. Let’s focus on the middle chart in Chart 2 which is titled Domestic Financial Debt. That is the growth in leverage on the part of financial institutions. You can see this cycle we were running at negative growth rates to start the cycle and have only recently gotten up to 3.3% growth. Compare that to the average of the time frame (1952-2019) of 11.0%. Past cycles like the mid 2000’s and the late 1990’s saw growth somewhere between 15% and 20%. The point here being the financial sector has been growing leverage at a dramatically lower rate than past cycles. Now most of this is the result of the financial crisis. Regulators have forced banks to deleverage and have been reluctant to allow them to lever up again. This is also part of what has limited economic growth this cycle but also limits the downside, in our mind, if the economic slips up here.
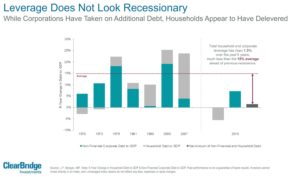
The top chart in Chart 2 looks at total domestic nonfinancial debt. This includes household and the corporate sector excluding financial institutions. Again, you can see the run rate in year over year growth is below long-term trends (5.6% vs. 7.2%) and dramatically below peaks (10% or more) of past cycles. This cycle, the household sector has actually deleveraged as homeowners licked their wounds from the financial crisis. Chart 3 from ClearBridge Investments shows that household debt to Gross Domestic Product (GDP) has decreased this cycle. This contrasts the dramatic increase of debt to GDP in the last cycle that preceded the Great Recession. Corporations have helped pick up some of the slack but not enough to get back to long-term averages of past cycles.
Chart 2: Per Ned Davis Research, Credit Market Debt Growth (1952-2019)
Chart 3: Per ClearBridge Investments: Household and Corporate Leverage Does Not Look Recessionary
Financial Intermediaries Funding Costs
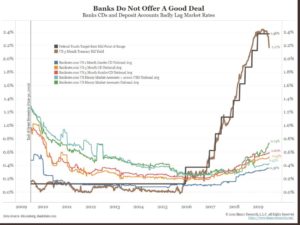
Past cycles were susceptible to yield curve inversions because as the Federal Reserve raised interest rates, banks needed to chase funding sources to maintain the loan growth rates mentioned above. Chart 5 shows that during past cycles, in order to keep the loan engine humming, banks ran their Loan/Deposit ratios close to 1x. This means a new loan was covered with new and higher cost deposits. Thus, when the yield curve inverted, the banks’ profit margins were compromised and the incentive to make that next loan went away. This cycle, as Chart 4 shows, banks held rates low as the Federal Reserve raised rates nine times. As most of us can attest to, checking, saving and CD rates have barely budged. Chart 5 explains part of this as banks are sitting on far more deposits today than at the peak of past cycles. Thus, the combination of low loan growth rates this cycle and low loan to deposit ratios means financial institutions never felt the need to chase funding and instead have sat still and held onto excess reserves. Again, this is mostly a consequence of the financial crisis. Regulators have forced financial institutions to hold excess reserves against potential losses. Also, the low interest rate environment of the past decade has numbed depositors to pushing for higher rates on deposit accounts. Today, 24% of all bank deposits are noninterest bearing deposits[1]. This is down from 28% in 2015 but still well above any level seen over the past 30-years (source Bianco Research LLC). In short, banks this cycle are funding loan growth with rates that are disconnected from where the Fed has taken short-term rates. While the treasury yield curve might be inverted, banks’ yield curves have not followed suit like in the past. This does not mean banks’ margins will not suffer as a result of lower rates. They will, but maybe this cycle with funding costs and growth rates low, banks will be more likely make that next loan because there still is a margin.
Chart 4: Per Bianco Research, LLC – Bank Deposit and CD Rates
[1] Source: Bianco Research, LLC
Chart 5: Per Ned Davis Research: Banks Loans/Deposits
Summary
The yield curve has inverted and everybody is jumping on the recession bandwagon. While we are not making a recession call, we do feel it is helpful to study the effects of the yield curve on important parts of the economy. Our analysis shows that if the economy does find its way into a recession, it may be shallow as the imbalances of past cycles do not exists this cycle. The equivalent of falling out the basement window.
With this curve inversion, volatility has spiked up again. We want to reiterate that volatility does not worry us. Volatility spikes happen every year and in fact most years you see volatility spikes three or four times. We look for dislocations as a result of spikes in volatility to find opportunities that have attractive long-term, risk adjusted returns. Not every spike has these opportunities and as of this writing we have not made any changes. We still slightly favor risk assets despite taking some risk off the table in the first part of the year thanks to strong equity returns. With the strong rally in treasury bonds over the last few months, we do not feel the risk adjusted returns are optimal for adding more treasuries today. We continue to monitor key developments in trade and the yield curve to consider moves one way or the other. Again, with a focus on determining if risk is being priced correctly. Thank you for reading this piece. Please contact us with any questions you may have about this or other topics.
Download a printer friendly version here.
Disclosures
The opinions voiced in this material are for general information only and are not intended to provide specific advice or recommendations for any individual. To determine which investments may be appropriate for you, consult me prior to investing. All performance referenced is historical and is not a guarantee of future results. All indices are unmanaged and cannot be invested into directly. The hypothetical example provided is not representative of any specific situation. Your results will vary. The hypothetical rates of return used do not reflect the deduction of fees and charges inherent to investing. All investing involves risk including loss of principal. NO strategy assures Success or protects against loss. Stock investing involves risk including loss of principal. Bonds are subject to market and interest rate risk if sold prior to maturity. Bond values will decline as interest rates rise and bonds are subject to availability and change in price. Investment advice offered through Shepherd Financial Partners, LLC, a registered investment advisor. Registration as an investment advisor does not imply any level of skill or training. Securities offered through LPL Financial, member FINRA/SIPC. Shepherd Financial Partners and LPL Financial are separate entities. Additional information, including management fees and expenses, is provided on Shepherd Financial Partners, LLC’s Form ADV Part 2, which is available by request.


