by: Brian Davies, CFA – Chief Investment Officer

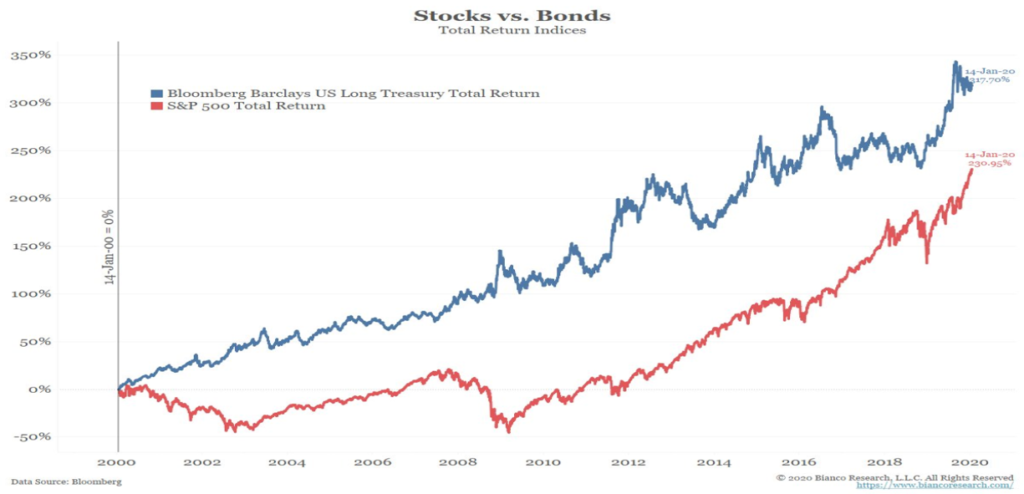
Long-term Treasury Bonds beat stocks (S&P 500) over the past 20-years. Unfortunately, looking in the rearview mirror is not a great investment strategy. Let’s consider part of what drove the divergence in performance and how to think about what the future might hold. The 317.7% cumulative return for long-term treasuries annualized to about 7.4% per year. Consider at the end of 1999, the U.S long-term treasury bond (See Chart 2: 20-Year Treasury Rate) was yielding 6.83%. That starting yield is equal to 92% of the 7.4% annualized return for the asset class. That matches what history tells us about bonds, that 90% of your total return will be driven by your starting yield. If that fact holds, then bonds moving forward will be hard-pressed to match the outsized returns of the past 20-years. Today, as Chart 2 shows, the starting yield on 20-year treasury bonds is 2.16%. That is 68% less than the starting yield in December 1999. For bonds to replicate the past twenty years returns they would have to garner the majority of that return from price appreciation. If that were to be the case, then they would be behaving very similar to stocks and other asset classes that rely on price appreciation for return rather than income. Over the long-term, our strategic position is to continue to favor stocks over bonds. The starting yield on most fixed income is just too low to earn an acceptable long-term return.
Chart 2

Disclosures
Content in this material is for general information only and not intended to provide specific advice or recommendations for any individual. All performance referenced is historical and is no guarantee of future results. All indices are unmanaged and may not be invested into directly. Government bonds and Treasury bills are guaranteed by the US government as to the timely payment of principal and interest and, if held to maturity, offer a fixed rate of return and fixed principal value. The Standard & Poor’s 500 Index is a capitalization-weighted index of 500 stocks designed to measure performance of the broad domestic economy through changes in the aggregate market value of 500 stocks representing all major industries.
1-939529
