Written by: Chris Cogliano, Portfolio Specialist/Investment Analyst
Key Takeaways:
- The performance of major equity groups reversed in April: U.S. Large Caps, U.S. Small Caps, and Developed International Equities underperformed while Commodities and Emerging Market Equities posted positive returns.
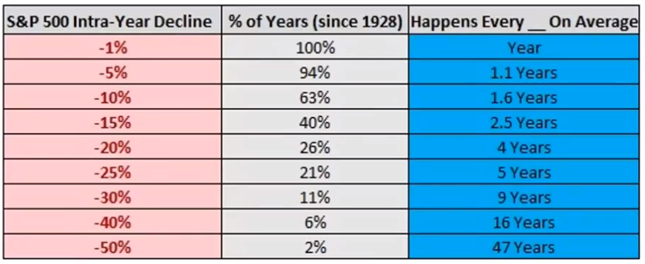
- As outlined in the Chart of the Month, intra-year declines happen frequently. Don’t let market volatility distract you from your long-term goals.
Market Recap:
Most asset classes were weak in April. This is not unusual given the strong start to the year and the positive equity returns for the previous five months. Despite overall weakness, Commodities were up 1.6%, mainly thanks to metals and energy. Another positive performer was Emerging Market Equities, up .75%. The biggest contributor to this index was China, which has been exceedingly weak in the trailing 12 months.
The biggest underperformers of the equity group were U.S. Small Caps, U.S. Large Caps, and International Developed Equites, which were down 7%, 4%, and 2.4% respectively. This pullback in major equity asset classes is considered normal and will be discussed in our chart of the month below. Fixed Income continued to underperform in April. Although we have seen sub-classes like High-Yield and Investment Grade Corporate with positive trailing twelve month returns, the Bloomberg Aggregate – the universal Fixed Income benchmark – has been weak for quite some time now, down 2.5% in April. This is mainly due to the current interest rate environment. Interest rates have been moving higher and there has been volatility in the expectations of where rates are headed.
Chart of the Month:

Source: @BespokeInvest
April’s Chart of the Month shows historical data on intra-year declines of the S&P 500 and the frequency of these declines. As we know, there is volatility in the equity markets; this much has never changed. What is interesting is the frequency at which we see intra-year declines. For example, historically we have seen a 1% decline in the S&P 500 every year. That is not newsworthy. Even a 5 or 10% drop can be anticipated every 1.1 to 1.6 years respectively. More significant drops happen less frequently, but probably more often than one would expect. For instance, a 25% drop happens, on average, every five years.
As for real world examples, in 2018 we saw a 19.4% drop in the S&P, then again in 2020 we saw a 33.8% drop. Both events were driven by different factors: 2018 was driven by interest rates and 2020 was driven by COVID. Another recent example is the 2022 bear market where the S&P was down 24.5% at its lowest. We also had a minor correction in summer 2023 of about 10 percent but by year-end, the S&P rebounded. In summary, market declines happen often and are driven by unpredictable factors. These corrections will continue to occur, but a long-term strategy helps investors bridge these periods of volatility.
What does this mean for you?
Have a long-term plan and balanced portfolio that fits your individual needs. This type of planning helps eliminate the uncertainty around situations like these and can increase your experience as a long-term investor. If you have any questions, please reach out to your Shepherd Financial Partners advisor.
Disclosures
Content in this material is for general information only and not intended to provide specific advice or recommendations for any individual. All performance referenced is historical and is no guarantee of future results. The economic forecasts set forth in this material may not develop as predicted and there can be no guarantee that strategies promoted will be successful.
All indices are unmanaged and may not be invested into directly.
The opinions voiced in this material are for general information only and are not intended to provide specific advice or recommendations for any individual.
Investment advice offered through Shepherd Financial Partners, LLC. A registered investment advisor. Registration as an investment advisor does not imply any level of skill or training.
Securities offered through LPL Financial, member FINRA/SIPC. Shepherd Financial Partners and LPL Financial are separate entities. Additional information, including management fees and expenses, is provided on Shepherd Financial Partners, LLC’s Form ADV Part 2, which is available by request.
The content is developed from sources believed to be providing accurate information.
Source: @BespokeInvest
Tracking #: 574445
