February 2022
An in-depth look at the numbers.
Welcome to our new series on Capital Markets where we provide a detailed review of market movement over the previous period. We hope you enjoy this new content and we appreciate your feedback.
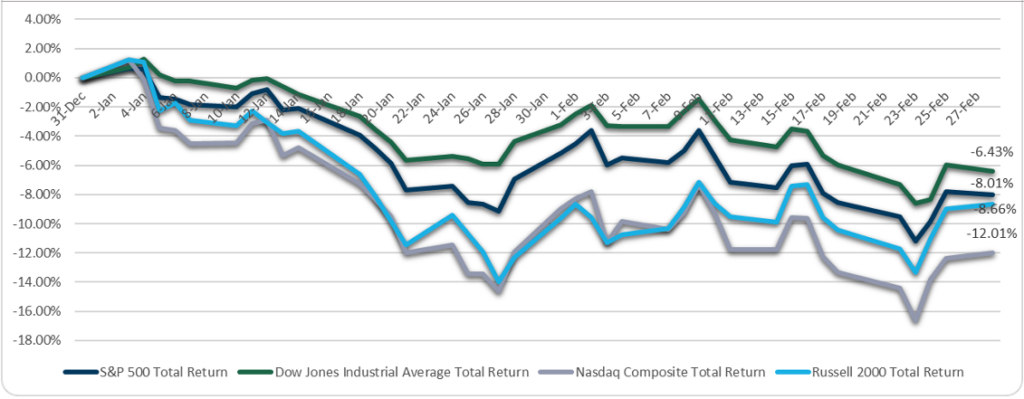
Volatility reigned during the months of January and February. January’s performance was impacted by the presence of the omicron variant with cases peaking in late January. February kicked off with a series of disappointing corporate earnings announcements that stalled US equity markets. A release of higher-than-anticipated inflation data weighed on markets further before geopolitical tensions took center stage as Russia launched its invasion into Ukraine. The effects of these conditions on domestic and international markets can be seen in the table below.
Major Asset Class Overview

Major U.S. Indices
As for the US indices, all major indices declined for a second consecutive month; with the S&P 500 entering correction territory as the index fell as far as 12% from its January 3rd high. The U.S and other western countries responded to the attack on Ukraine with sanctions targeted at weakening Russia’s economy, which forced investors to speculate the potential impacts to corporate earnings, inflation, supply chain dynamics, and the global economy. As of the end of February, the S&P 500 year-to-date losses were at -8.01%.

Sector Contributions
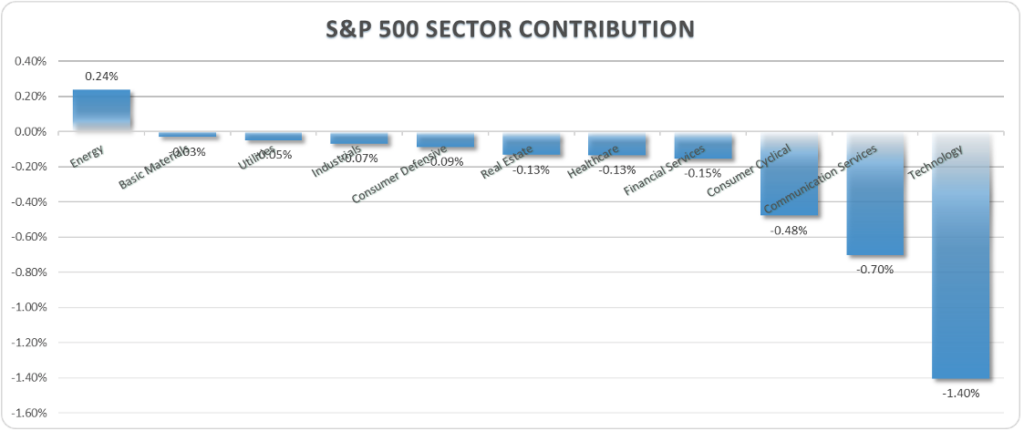
Let’s dive deeper into which sectors did well and which did not. The Energy sector (+7.13%) was once again the only positive contributor during February adding 24bps to the index’s performance. The Technology sector (-4.90%) was the largest headwind during the month, detracting 140bps followed by the Communication Services sector (-6.98%), which detracted 70bps.

International Equity
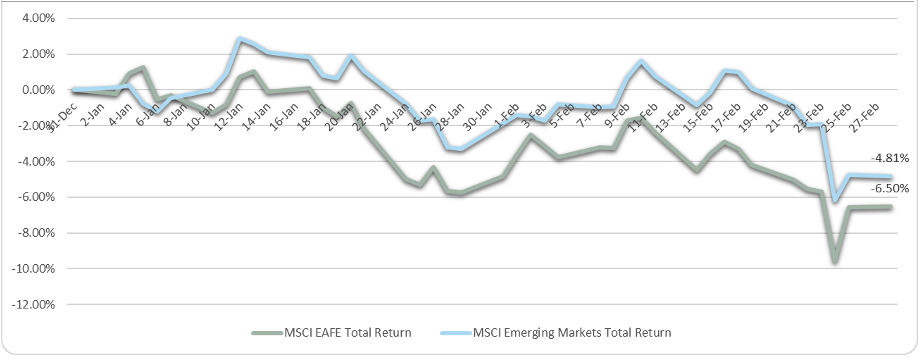
In International markets, European equities sold off dramatically after Russia announced its invasion into Ukraine. Russia is a major commodities producer and exporter, supplying Europe with nearly 40% of its natural gas and 25% of its oil, in addition to being the world’s largest wheat exporter. The potential of negative supply shock caused energy and wheat prices to spike, further clouding the inflation picture and economic growth potential. A sustained period of elevated energy and food prices could add to inflationary pressures, reducing consumers’ disposable incomes and limiting economic growth. This dynamic has most central banks performing a delicate balancing act as they seek to mitigate inflation by raising interest rates, during a period where they would normally ease monetary policy to stimulate growth.

Domestic Fixed Income
Fixed Income markets were also negative in February, with the Bloomberg Barclays US Aggregate Index down 1.12%.
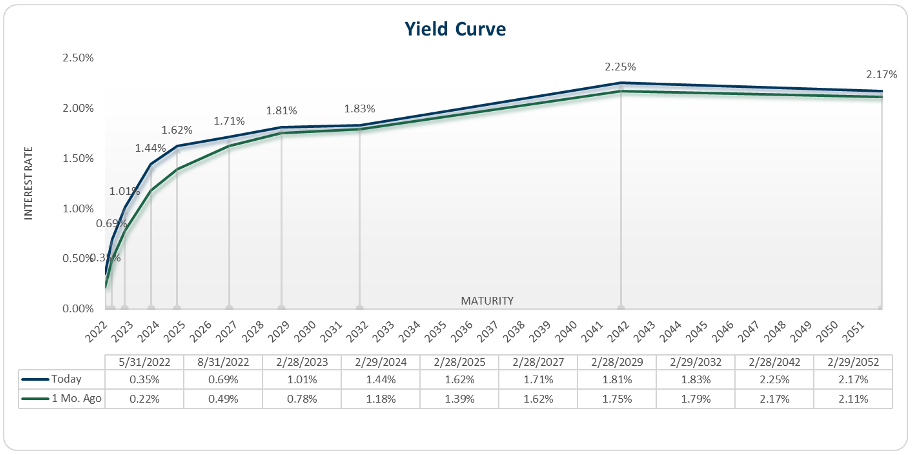
- Yields across the treasury curve edged higher in February with front-end rates garnering much of the move.
- Investment basics: Yields move opposite to bond prices.
- The spread between the 10 Year Treasury Rate and the 2 Year Treasury Rate narrowed from 61bps to 39bps.
- Investment basics: A 10-2 treasury spread that approaches 0 signifies a “flattening” yield curve. A negative 10-2 yield spread has historically been viewed as a precursor to a recessionary period.

Month Ahead
For the global economy, energy price fluctuations over the coming weeks and months will be a key indicator to watch, and in turn, how central banks react.
Other key indicators to watch:
- January JOLTS Report– Wednesday, March 9th
- CPI – Thursday, March 10th
- FOMC Announcement – Wednesday, March 16th
- February JOLTS Report – Tuesday, March 29th
- GDP – Wednesday, March 30th
Please reach out to us with any questions you may have. We are here to serve you!
Disclosures:
The source of all data from charts/graphs derived from YCharts.
Content in this material is for general information only and not intended to provide specific advice or recommendations for any individual. The economic forecasts set forth in this material may not develop as predicted and there can be no guarantee that strategies promoted will be successful. All indices are unmanaged and may not be invested into directly. Unmanaged index returns do not reflect fees, expenses, or sales charges. Index performances not indicative of the performance of any investment.
Past performance is no guarantee of future results.
Investment advice offered through Shepherd Financial Partners, LLC, a registered investment advisor. Registration as an investment advisor does not imply any level of skill or training.
Securities offered through LPL Financial, member FINRA/SIPC. Shepherd Financial Partners and LPL Financial are separate entities.
Additional information, including management fees and expenses, is provided on Shepherd Financial Partners, LLC’s Form ADV Part 2, which is available by request.
This information is not intended to be a substitute for individualized legal or tax advice. Please consult your legal and/or tax advisor regarding your specific situation.
Tracking #: 1-05253360
