• A major shift from the Federal Reserve provided fuel for equities and the S&P 500 had its best 1st quarter in 20-years.
• Bonds also rallied in the quarter and the front-end of the yield curve became inverted.
• We will discuss how we are positioned as we head into the 2nd quarter and consider catalysts for market moves ahead.
After a violent sell-off in risk assets during the 4th quarter of 2018, one in which the S&P 500 had its worst December since 1931, the market reacted very favorably to the U.S. Federal Reserve’s dovish shift in monetary policy. Risk assets rallied with double digit returns across a number of asset classes. In fact, the quarter was so positive that typically defensive asset classes also saw strong returns. While the Fed’s move was cheered by investors, we have to keep in mind the strong rally still has not returned equities to the highs seen in early October of 2018. With the Fed on the sidelines for the time being, we believe the stage is set for risk assets to test those highs as we make our way through the second quarter.
The next few pages will review where the economy is and discuss what could be in store going forward. We will cover the performance of the equity and bond markets and provide an update on how we have the portfolios positioned for key market catalysts ahead.
Economic Review:
As anticipated with the Q4’182 market correction in risk assets, the U.S. economy is estimated to have grown around 1.75%3 in the first quarter. This is significantly slower than the near 3.0%4 growth rate that was seen in the middle of 2018. The ongoing trade discussions between the U.S. and China clearly put global companies in wait and see mode. Orders were held back as companies seem to want to see what the tariff situation will ultimately be. Higher interest rates also caused rate sensitive industries like Residential Real Estate and Autos to slow.
Employment continued to be strong as the economy added 180,0005 jobs on average per month during the 1st quarter. This number proved very volatile as January produced a very strong 312,0006 jobs and February only produced 33,0007 . The month-to-month data can be misleading. The quarterly trend still signifies a robust employment situation in the U.S.
Inflation remained subdued and continues to come below the Federal Reserve’s 2.0% target. We did see wage growth pick up in the monthly jobs data during Q1. After spending most of this cycle barely budging, wage growth grew 3.2%9 year over year in March, which was a slight pull back from the 3.4%10 growth seen in February. The trend is in a positive direction and is a positive catalyst for consumer behavior as we move through 2019.
Outside the U.S., Developed and Emerging economies continued to struggle with slower growth. The threat of a trade war is clearly having a bigger impact on international economies than the U.S. economy. China has implemented aggressive policies to loosen financial conditions with the hopes of maintaining the country’s 6.0%11 or better GDP growth rate. European economies continued to be stuck in a rut as markets like Germany depend on emerging markets like China to buy products such as German automobiles. While we have yet to see a resolution in the trade situation, near the end of Q1 we did start to see some green shoots appear in international economies. China’s manufacturing in March jumped back above 5012 , signaling economic growth accelerating. Eurozone data has some early signs of stabilization during March. While one month does not make a trend, we are encouraged that economies outside the U.S. could potentially surprise to the upside at some point in 2019.
Equity Markets:
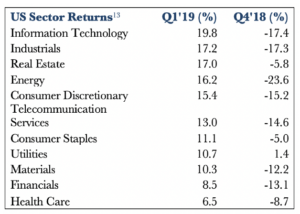
Equity markets in the U.S. rebounded strongly from the sharp sell-off in Q4. The market was led by the Technology sector, Industrials, and Real Estate Investment Trusts (REITS). Financials lagged in the quarter as investors worried the inverted yield curve would have a negative impact on future earnings. The Health Care sector was also a laggard as some company specific news with big pharma held the sector back a bit in the quarter. The Health Care sector has become an easy target for politicians in Washington, DC looking to change pricing of services and drugs.
Corporate earnings have slowed dramatically from the pace set in 2018. While we saw earnings growth around 20%14 in every quarter but Q4, the consensus estimate for S&P 500 2019 earnings has come down from 10%15 to start the year to around 3.5%16 growth today. We believe the Q4 correction in capital markets had a lot to do with this trend change.
Investors were worried the earnings growth slowdown was going to turn into something worse. We have always believed that the earnings growth rates seen in the first three quarters of 2018 were unsustainable and had to come in. Those growth rates were a product of the 2017 tax reform which lowered the corporate tax rates. Analysts had a hard time gauging the full impact of these new rates on companies’ bottom lines. That’s why the trend in estimates moved higher throughout 2018. Normally, analysts start out overly confident and lower their estimates as we move through the year. 2018 saw the opposite of this.
It was always going to be hard to sustain those 2018s earning’s growth rates. The comps become too much and, in our mind, were going to lead to more sustainable growth rates between 3-5% for 2019. Yes, some of the decrease in growth rates is due to the lingering impact the trade situation is having on business activity. We would expect the uncertainty to linger until a deal is finalized. While the trend in growth is negative, we are comfortable today with Wall Street’s estimate of 3.5%17 earnings per share growth in 2019.
With the strong move in equity prices in Q1, valuations have moved a bit higher. The forward price to earnings ratio on the S&P 500 has moved from 16.0x18 to start the year to almost 17.0x19 at the end of the quarter. This is slightly elevated from long-term averages on forward earnings at 15.0x20. The peak in 2018 saw a PE of 18.0x21 and the peak in 2017 had valuations at 19.0x22. While the absolute level today is not that worrisome in our minds, we recognize that valuations on U.S. equities are moving higher and as a result we are laser focused on a potential disconnect from valuations and the fundamentals.
Emerging & Developed International Markets
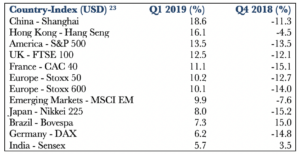
Emerging Markets stocks saw strong returns in Q1 as global investors returned to risk-on mode. While trade was still on the top of investors’ minds, actions by central banks around the world gave investors confidence as we moved through the quarter. China has attempted to stimulate its economy again after trade rhetoric weighed on growth last year. Liquidity has been added to the system again in China and investors are hopeful this will lead to a return of accelerated growth rates.
Developed International Market equities also saw positive returns in the quarter but were somewhat subdued compared to equity returns in the U.S. and Emerging Markets. Germany, for example was up only 6.2%24as the economic data coming from the EU’s major growth engine continued to disappoint. Germany, as a proxy for the developed European region, has struggled with the double whammy of a trade battle between China and the U.S. and the ongoing uncertainty of Brexit.
Valuations in Emerging Markets and Developed International equities continue to be below long-term averages and are well disconnected from valuations seen in the U.S. We found this pricing disconnect attractive at the end of ’18 and increased our exposure to these markets but still remained underweight these regions. As we move forward, hopefully we can get some clarity to the issues that hold back these markets. As always, we will adapt as the news flows through and study opportunities based on the best risk/reward opportunity for our clients.
Fixed Income Markets:
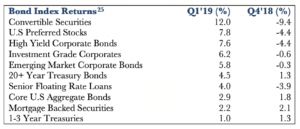
The risk-on attitude that dominated the equity markets in the quarter was also seen in the bond market. Almost all fixed income categories saw positive returns. The first quarter was one of the rare periods when both risky and defensive assets performed strongly, although to differing degrees. The bond market was influenced by the Federal Reserve, which pivoted sharply away from the monetary tightening that has been in place for the prior two plus years. This propelled rates lower and the curve became flatter and even inverted at the end of the quarter. The 10-yr treasury rate started the quarter at 2.62%26 and fell to a low of 2.37%27 during the last week of the quarter. Investors jumped at the chance to add duration to their portfolios when the Federal Reserve came out an said it would pause hiking rates. Longer duration fixed income products did very well while securities positioned at the front end of the interest rate curve were little changed.
The move towards longer duration during the quarter caused the front-end of the yield curve to invert for the first time since 2007. This means the yield on the 10-yr treasury notes was lower than the yield on 3-month treasury bills. Investors seemed very concerned about this development and we saw a couple days of risk off attitudes around the inversion. While we believe the yield curve does have some abilities to tell us where we are and where we are going, it has worked in the past when the entire yield curve inverted, not just when one part of the curve inverts. Plus, the yield curve has been flattening for a long-time and it did not just happen in Q1. We have been monitoring this and expected an inversion if the Fed kept hiking rates. Now that they have stopped in the near-term, we think the probability of the entire curve inverting anytime soon is lower than in Q4 when it was believed the Fed had two or three more interest rate hikes coming in 2019.
In fact, as we sit here early in Q2, the 10-yr/3-mth part of the curve is positive again. We will continue to monitor rates but the real determination of where rates move next will come later this year if and when the Federal Reserve decides to move again.
After a strong sell-off during Q4, high yield and other credit related investments performed well in Q1. Credit spreads narrowed throughout the quarter and are not that far off from the lows of this cycle. Like equities, credit investors seemed back in risk-on mode again after the brief scare of Q4. We have moved away from risky credit exposure and we believe the risk/return profile of the category at these credit spreads is just not attractive. We have taken steps to limit our credit exposure overall in Fixed Income and on average our holdings have credit ratings of A rated or better. If there is one area in the economy where froth could exist it’s in corporate credit as non-financial debt is back to a high not seen since just before the financial crisis. While these levels can always move higher, especially if the fed does not resume its tightening cycle, we feel it’s best for us to wait for better prices in the hopes that the risk/return profile will be in our favor.
Summary: Positioning heading into Q2’19
In summary, we continue to favor an overweight position in equities versus fixed income and domestic equities versus international. We have taken our equity exposure down a bit from where we were to start the year, but still have a bias towards equites over bonds given attractive equity earnings yields compared to fixed income rates. Within equities, we favor growth and quality factors with an eye towards defensive positioning as the cycle extends. Our Fixed Income exposure is only slightly underweight duration (interest rate risk) relative to the Barclays Aggregate Benchmark. With the Federal Reserve in pause mode today, we don’t want to take much of an aggressive bet on rates one way or the other because the Fed might pivot again and surprise bond investors. As we mentioned above, credit does worry us moving forward and we have moved to limit exposure to areas like high yield bonds and bank loans. We continue to expect volatility to appear from time to time in 2019. We believe normal markets have volatility. As we have said in the past, as opportunistic long-term investors we view volatility as a chance to take advantage of dislocations and earn attractive returns, as long we feel the risk/return dynamics are balanced in our favor.
Disclosures:
* Forward Price to Earnings is price divided by consensus analyst estimates of earnings per share for the next 12-months
** A basis point is commonly used to express differences in expenses or interest rates. 1bp=0.01%
Bloomberg Barclays U.S. aggregate bond: The Bloomberg Barclays U.S. Aggregate Bond Index is an index of the U.S. invest¬ment-grade fixed-rate bond market, including both government and corporate bonds.
S&P 500: The Standard & Poor’s 500 Index is a capitalization weighted index of 500 stocks designed to measure performance of the broad domestic economy through changes in the aggregate market value of 500 stocks representing all major industries.
The Bloomberg Commodity Index (BCOM) is a broadly diversified commodity price index.
The opinions voiced in this material are for general information only and are not intended to provide specific advice or recommen¬dations for any individual. Economic forecasts set forth may not develop as predicted and there can be no guarantee that strategies promoted will be successful. All performance referenced is historical and is no guarantee of future results. All indices are unmanaged and may not be invested into directly.
Stock investing involves risk including loss of principal.
Bonds are subject to market and interest rate risk if sold prior to maturity. Bond values will decline as interest rates rise and bonds are subject to availability and change in price.
Duration is a measure of the sensitivity of the price (the value of principal) of a fixed income investment to a change in interest rates. It is expressed as a number of years. Rising interest rates mean falling bond prices, while declining interest rates mean rising bond prices. The bigger the duration number, the greater the interest-rate risk or reward for bond prices.
High yield/junk bonds (grade BB or below) are not investment grade securities, and are subject to higher
interest rate, credit, and liquidity risks than those graded BBB and above. They generally should be part of a diversified portfolio for sophisticated investors.
Floating-rate loans are often lower-quality debt securities and may involve greater risk of
price changes and greater risk of default on interest and principal payments. The market for floating-rate loans is largely unregulated and these assets usually do not trade on an organized exchange. As a result, floating-rate loans can be relatively illiquid and hard to value.
International investing involves special risks such as currency fluctuation and political instability and may not be suitable for all investors. These risks are often heightened for investments in emerging markets.
Investment advice offered through Shepherd Financial Partners, LLC, a registered investment advisor. Registration as an investment advisor does not imply any level of skill or training.
Securities offered through LPL Financial, member FINRA/SIPC. Shepherd Financial Partners and LPL Financial are separate entities.
Additional information, including management fees and expenses, is provided on Shepherd Financial Partners, LLC’s Form ADV Part 2, which is available by request.


